| Developer Testing in Visual Studio 2012 has been improved a lot and it is allowing them to concentrate more on the code they are writing in the application. In addition to the testing framework that comes with Visual Studio 2012, you can easily add third-party testing frameworks in the IDE. This post discusses the new unit and integration testing features for developer in Visual Studio 2012. |  |
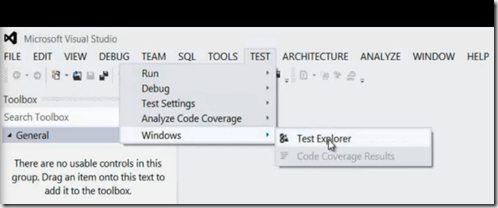
To open the new Test Explorer window, Select the Test Menu then choose windows and click Test Explorer
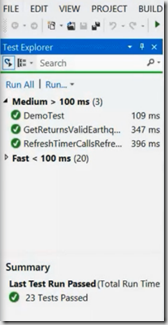
The look and fell of Test Explorer in VS 2012 is different in number of ways. You do not have too many different windows to say same information in new IDE, instead you have one widow that focus on unit and integration testing results.
When you select a test case in Test Explorer then you can see the detailed information about the test in below pane. The green bar in test explorer gives you quick view on the out-come.
Integrating Third Party Testing Frameworks
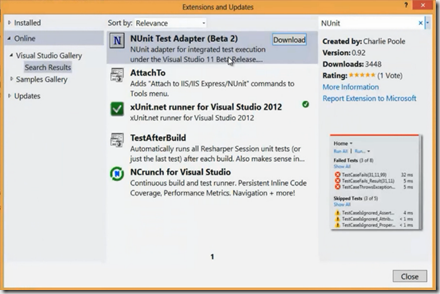
One of the important feature for developers for testing in this release is, it enables you to quickly integrate third-party testing frame-works in VS 2012. So If your team uses N-Unit or XUnit.net or some other testing framework then you can simply install Visual Studio extension.
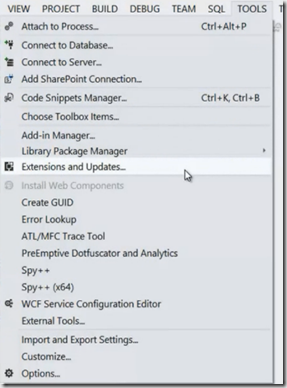
To open the Extension tools manager, Go to Tools and click Extensions and Updates
You can search the framework that you need and download as shown below
In Visual Studio 2012 Regard less of which Testing Framework you use, it is fast and scales up to thousands of test cases.
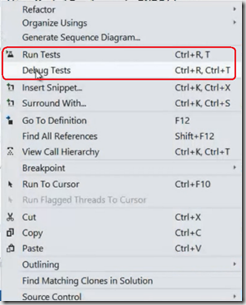
Developer testing is also very easy to use, If you want to Run or Debug the test that is in your editor then you can right-click on the code and select either run tests or debug tests.
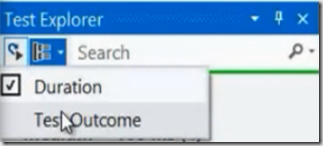
You can also Filter the test cases by entering the search term in Test Explorer. You can also group tests with different properties, You can group the tests either by Test Outcome or Duration.
If you often require to run unit and integration tests in your solution then with single click in Visual Studio 2012 you can accomplish with Run test after build feature.
Now your test will run as part of every build you do.
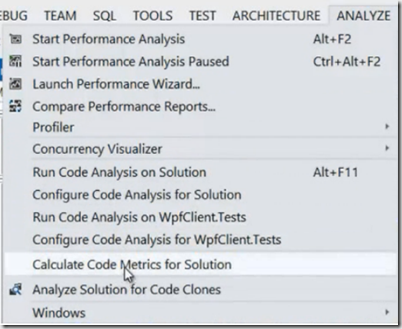
With a single-click you can analyze and understand various code-metrics about your solution.
The Code Metrics Results window will appear as below information like number of line of code , Class Cohesion and Depth of inheritance
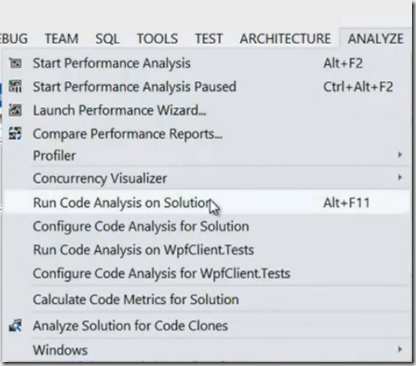
As it in previous visual studio versions, you can use Code Analysis Tool to quickly find common coding and design mistakes in your code
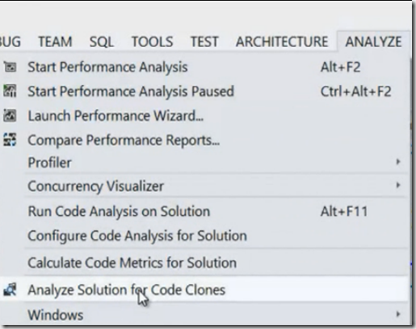
Another new feature in Visual Studio 2012 is Code Clone Analysis, using this feature you can scan your entire solution for duplicate code
Code Clone Analysis is smart enough to identify the duplicate code and groups the results with Exact match and medium match.
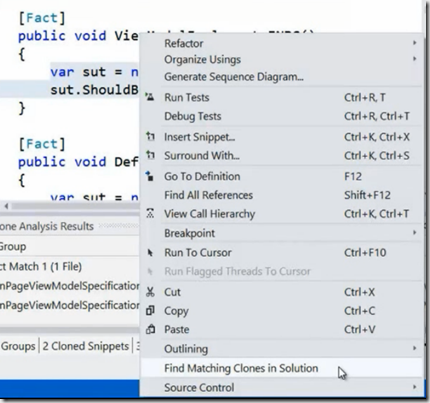
You can also use code clone feature that matches selected code in editor as shown below
Code Coverage Analysis
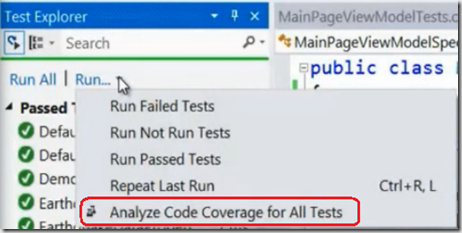
Code Coverage Analysis tool helps you to know how well your tests exercise your code? Code Coverage Analysis has significantly improved in Visual Studio 2012. To Analyze the code coverage of all the tests in your solution simply click Run drop down in Test Explorer
You can browse and explore the Code Coverage Results after completing the run
Unit test cases can also run in isolated mode with fakes framework, more information on this can be read here
Reference: Peter Provost’s talk on Visual Studio launch
| Share this post : |  |
 |
 |
 |
 |
