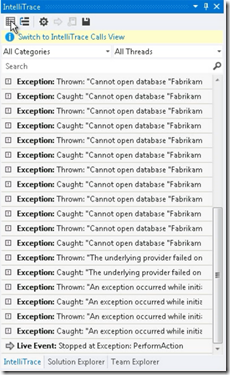
| IntelliTrace can be used to collect and analyze the data in production. IntelliTrace speeds debugging by showing history of what happened in your application while you run. This reduces how often you restart the application when you want look at past events. IntelliTrace automatically collects information about events when you start debugging. Some examples of events exceptions, break points and dot net events. You can also use IntelliTrace for calls information. |  |
You can select IntelliTrace Events and choose the events and event categories that you want to collect. You can examine the values for variables , inputs and outputs for functions and procedures. Selecting an event takes you to the code where that event happened.
You can then use the standard debugging windows to review the application state and examine the collected value. You can collect and save this information to a file.
This file contains the information about exceptions, web requests, test steps and other appropriate data. This file helps you to debug your application after crash and identify how to reproduce bugs.
Collecting the information from Applications in Production
You can use stand-alone collector to get IntelliTrace information about applications that are in production. You can use Power-Shell commands to collect the data and delete the collector when you are done. You can download this tool from here
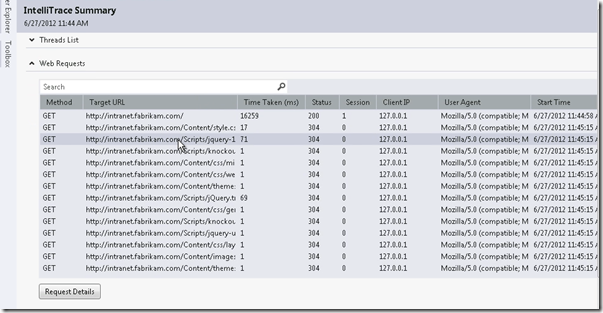
IntelliTrace collects the information with-out interrupting applications operations data. You can now open the file in Visual Studio 2012 , if the application is web then you can select the specific web request and see the details as shown below
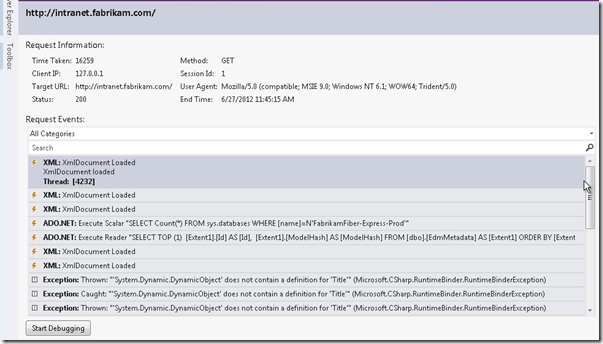
After selecting a particular web request then you will get all the associated events to that request , You can select a specific event and choose start debugging
Visual Studio takes you to the code where the event happened , Now you can use standard VS debugging experience with IntelliTrace to examine the collected values. You can definitely save debugging time using IntelliTrace by using applications history and state without restarting. It provides more debugging information and capabilities to find and fix bugs faster.
API reference for extensibility can found here
| Share this post : |  |
 |
 |
 |
 |


