This post outlines various options and tools for performing performance tuning on SQL Server. Performance tuning is ongoing, iterative process and it never stops. Typical performance tuning methodologies a
|
 |
Tuning the SQL Server while building offers a proactive approach to performance tuning. In order to build highly performance database application you need to start a proper database design and also consider the below steps
-
Tune the business rules
-
Tune the logical and physical design
-
Tune the application
-
Tune the database server
-
Tune the underlying platform
Application Tuning – Making sure your application can actually leverage
RDBMS features
Example: Perform calculations and summaries on the database before fetching the results.
Supporting schema objects
Example: choose appropriate indexes that perform data aggregations and calculations.
Tune Database Operations
Example: Find statements that consume most resources – Use statistics available in system catalog, such as parses , CPU time and physical reads. In order to minimize the amount of resources taken by the query, you can use the variety of techniques like creating appropriate indexes or adding statistics that improve and help query optimizer to choose better execution plan. Adding hints will help to override the default behavior of query optimizer.Tuning the access paths is also an important step , generally you want to tune access paths to your data. If Query optimizer does not pick the best execution plan then you can force that execution plan either by using hints or planning guides.
SQL Server Query optimizer is cost based optimizer, it chooses the plan based on the estimate of execution cost. Depending on the estimation of number of rows and amount of data that processed by query, different operators will have different estimated costs. If actual number of rows are more than the estimated number of rows in execution plan then it indicates a problem with the Query optimizer. To solve this problem provide more information to Query optimizer. It is important to have a reliable statistics about data distribution. SQL Server automatically refreshes the statistics based on some data modifications.
Instance Tuning – Tuning the resources is also important to identify the bottleneck. example: Memory allocation and memory utilization should be balanced. Tune the I\O by separating the files based on access and distribution of I\O load across files and devices. Reduce or eliminate contention for locks, latches , block headers and queues. One of the option could be data compression. Data compression improves your performance by limiting the number of I\O’s that is needed to read the objects from memory.
SQL Server Performance tuning tools
Profiler – Records detailed information on activity on the database server, including I\O statistics , CPU statistics, index and table scans , execution plans and several other statistics to aid in tuning SQL and T-SQL.
Distributed Replay – Distributed Replay is a new tool available in SQL Server 2012 which can be used for scalability testing or assessing the impact of hardware and OS upgrades.
Performance Data Collector – Fully integrated tool which collects variety of performance metrics on one or more SQL Servers and stores the data in a central data warehouse.
Database Engine Tuning Advisor – This is database physical design tool to optimize indexes and partitioning.
Performance Monitor – Windows tool that records counters at hardware, operating system , database and application levels.
Using the Data Compression – You can use this wizard to benefit from ROW or PAGE type options. Calculating the compression savings with wizard or scripts.
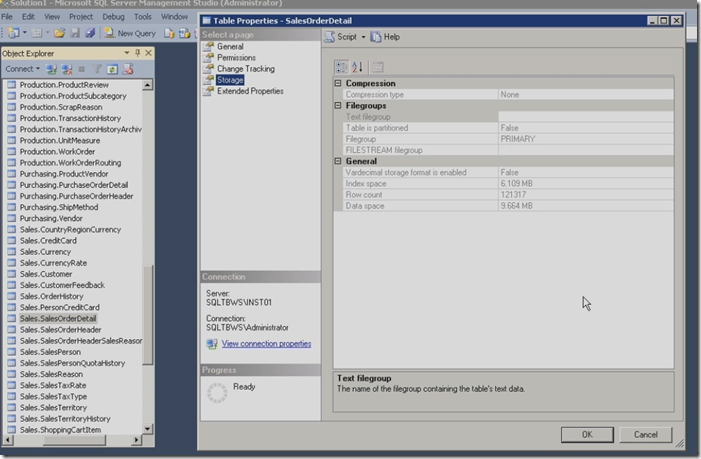
Open the Adventure works database table Salesorder details table, it has got 121K rows. If you look at the Data and Index space it is around 15MB. We can make this size smaller by applying compression
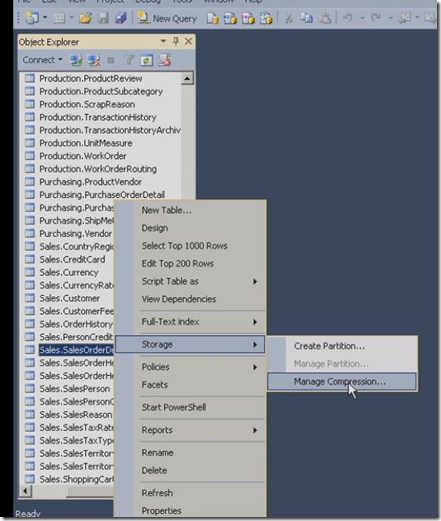
Launch the compression wizard as shown below
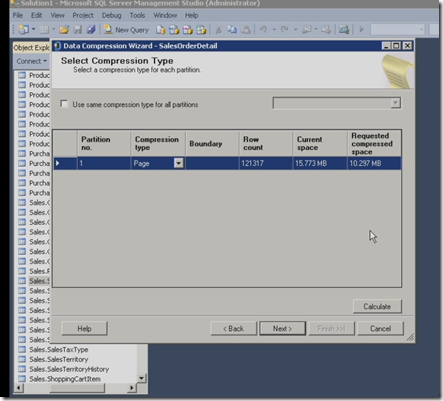
You can use this Compression wizard to change the compression levels
select the compression type Page and click calculate then it shows the current space and requested compressed space. You can also use the below SQL Script for compressing the table
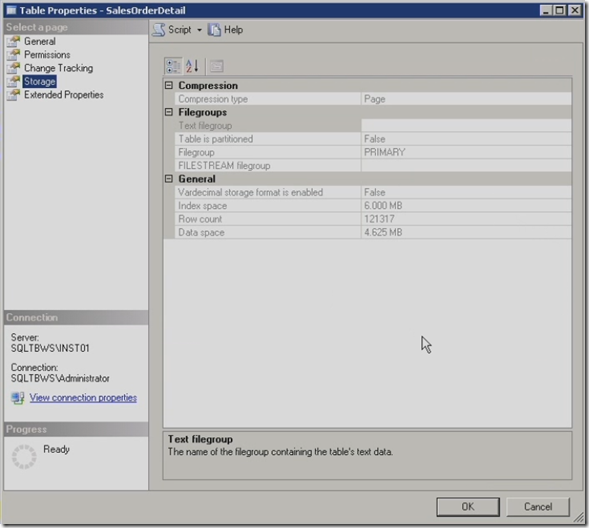
After compression the details of the table are as below
Capturing SQL Events happening in SQL Server with profiler
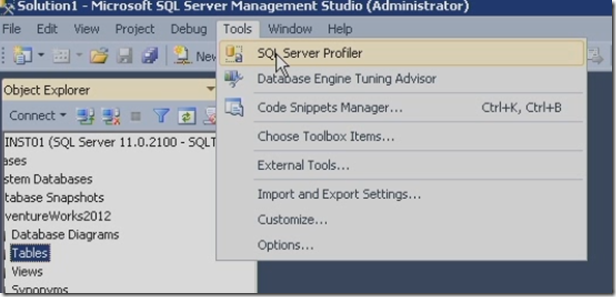
Start the SQL Profiler from SQL Server Management studio tools option
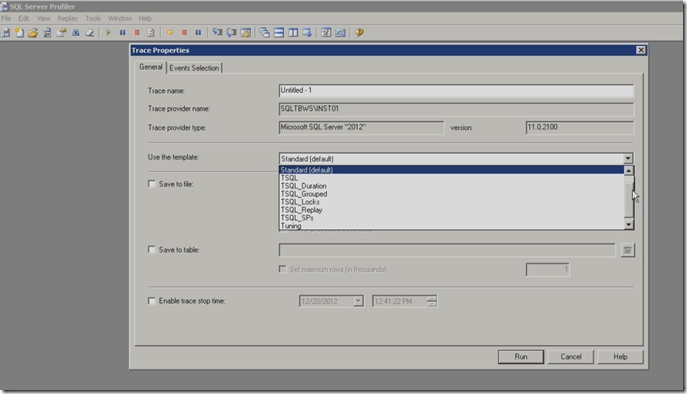
then select the profile template and the file to save the trace.
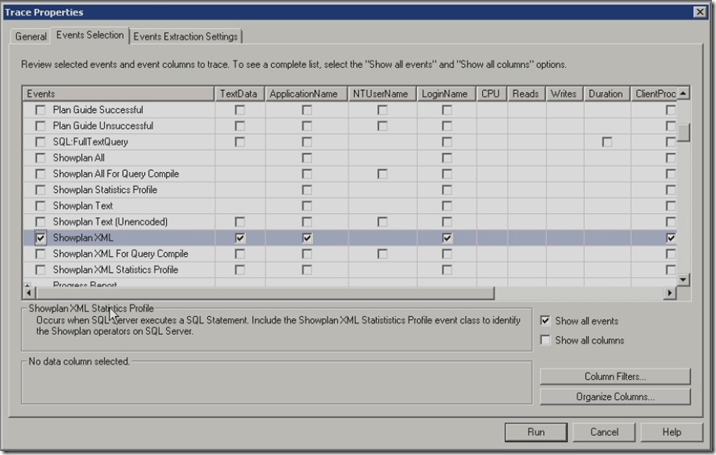
specify the events by navigating to the Events Selection. For example in order to see the execution plans of queries that are executing, select the Show Plan XML event under performance category then click run
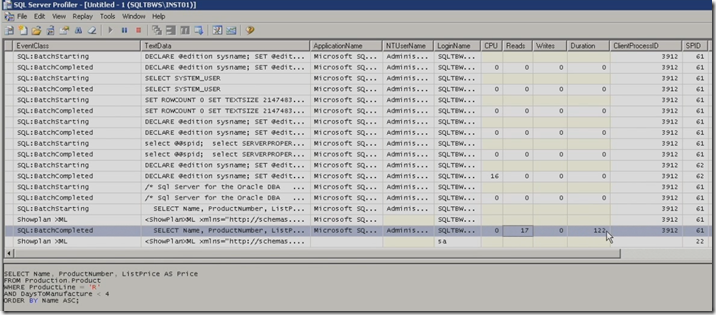
You can notice several events in profile result
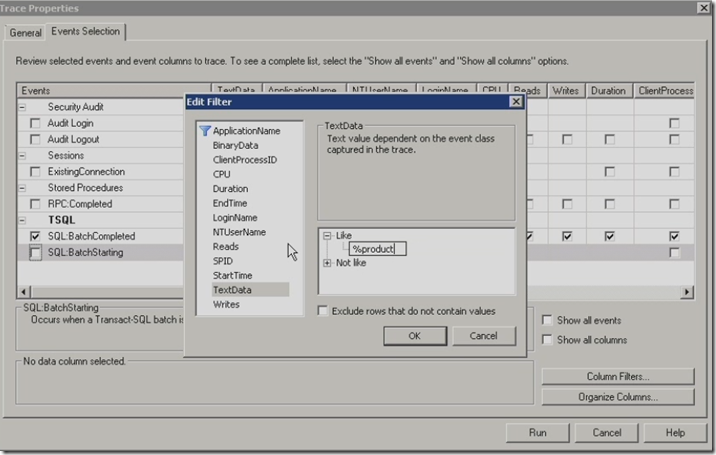
You can apply different set of filter while launching the SQL Profiler, In trace properties dialogue click the filter button and specify the condition as shown below
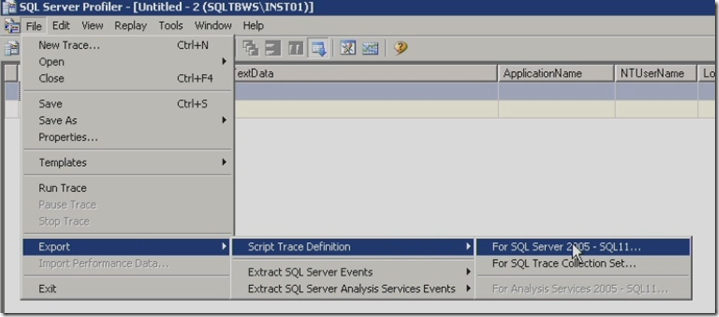
You can also specify or create the Trace definition file which is a SQL script which can be used to run on different servers as shown below
T-SQL Hints
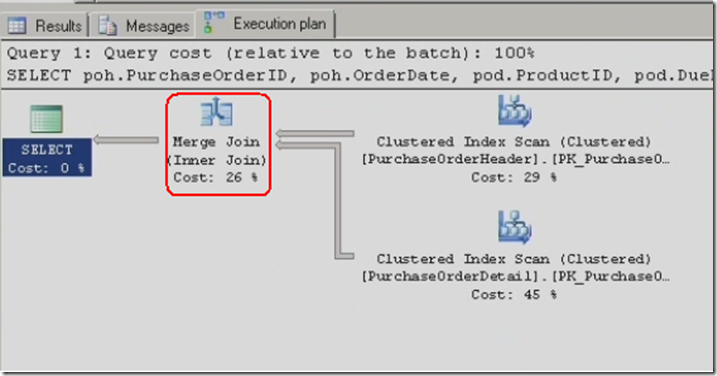
Enforcing HASH join in query, example is the below query and its execution plan
You can notice the execution plan is using Merge join. Executing the above query in other way may provide better performance by forcing Hash join in query as below
Using OPTIMIZE FOR as a T-SQL hint as shown below query
Executing the queries by removing the lock contention also helps in improving the execution plan
You can also place table level lock instead row level especially when there are more number of rows in the table
| Share this post : |  |
 |
 |
 |
 |
