Introduction
ASP.NET 3.5 SP1 having a new charting control which allows the developers to easily add different data visualizations to their web applications.The control supporting different chart types like column charts,line charts and pie charts and also advance chart types like funnel and pyramid charts.This post explains about using this control in web applications.
You can download the chart control here which installs all runtime components for using the control. It also places the System.Web.DataVisualization in GAC.
You can also download the Control Add-on for VS 2008 Tool box which gives you toolbox integration and intellisense support at design time.
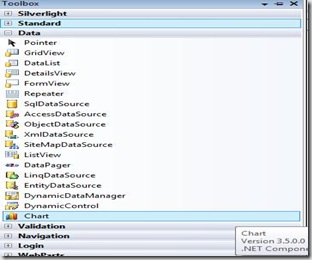
After the installation you can find the chart control in the toolbox window as shown below
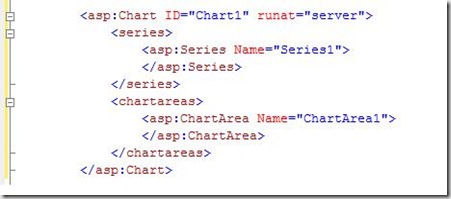
1. Drag the control to the web page, it makes the changes to web.config file control section as shown in figure
2. The basic elements of the ASP.NET 3.5 chart control are
- Chart Series
- Chart Area
Every chart contains at least one series which used to populate the data and can contain one or more chart areas for plotting.
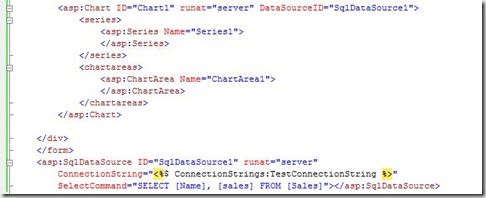
3. Add a SqlDataSource control to the web page and configure it for retrieving the data.
4. Specify the XValue and YValue members in code behind
Chart1.Series[0].XValueMember = "Name";
Chart1.Series[0].YValueMembers = "Sales";
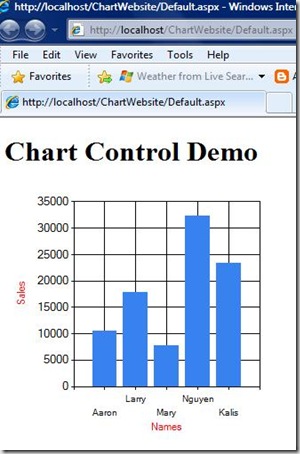
5. Run the application it shows the following output. By default ASP.NET Chart control shows the data in column type chart.
6. You can customize every element of ASP.NET Chart control , including backgrounds,axis,titles, legends and labels.
You can find more about developing different types of charts using ASP.NET 3.5 chart control here.


i need to create chart using xmlDatasource. can you help me?.
I am using MVC with MS chart control. i am trying do a drill-down of charts. while trying to do this i tried to implement
“url” in chart series by sending x and y axis values. but no results yet. is there any way to do this drill-down in charts (Passing url in chart series in MVC Pattern)
Very good sample thanks again 😉