Logging and tracing in microservice applications can be challenging and complicated if each microservice generates its own logging. Determining the application execution process flow and event co-relation can be a laborious task when microservice handling concurrent requests. Unified and Centralized logging ensures the deployed service remain reliable and resilient. This post outlines the logging strategy for microservices that helps in automating the effective logging and monitoring.
What are the challenges?
- Components in applications may have native log stores i.e. different storage locations and different logging formats, in other words not having a common location and common format.
- Control the access to log information.
- Retention policy.
- Data policy regulation and security requirements.
- Integration for analysis and alerts.
What are the options?
- Using an unified logging library that supports each technology stack in an organization can help in doing a structured logging. Light weight format of the logs like (JSON) is useful. Serilog provides sinks for writing events to various storage locations in different formats.
- AZURE has large number of metrics and logs – these are vary by resource type , Example: Logs that store for VM may different from logs that store for AZURE SQL.
- Follow the Observability principle – Monitoring the centralized logging in real-time can help in pro-actively fix the issues. UI to visualize this data can help. This central monitoring system then can be used to schedule alerts. when metrics in monitoring system going outside the SLAs or tolerating metrics then we need to have a quick way of alerting all the engineers in most effective way so that problem can be resolved.
- Use existing AZURE services as much as possible to achieve unified logging.
Logging Architecture
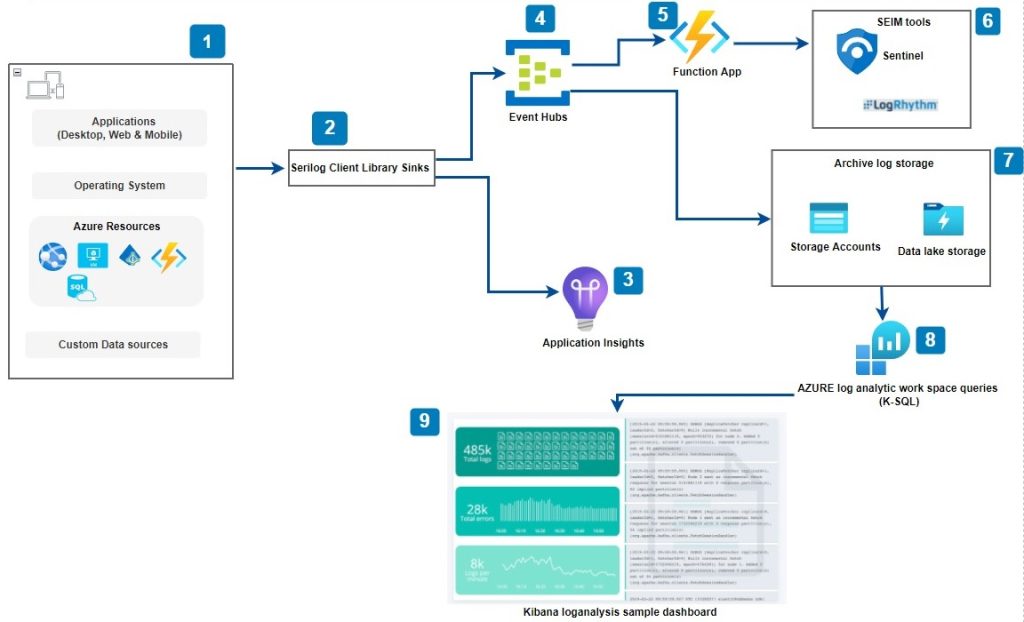
The following design uses the AZURE services to build a unified logging system
- Applications ( Desktop, Web & Mobile ) , Operating system , Azure resources (AppServices, VMs , Active Directory, Function Apps and Azure SQL etc) and Custom Data sources can use Serilog Client library to write the logging information.
- Serilog Client Library provides several links that listed here to emit information to various azure services in structured and unified fashion using templates.
- Application insights is an extensible application performance management service for developers and dev-ops professionals. It can be used for querying short-term(90 days) logging data. Serilog provides Application Insights sink to send the logging information from your applications. Note: logging to application insights is asynchronous.
- AZURE resources and Operating system event log information can be send to AZURE Event hub if your application require to send real-time logging information to SIEM (Security Information and Event Management) tools. EventHub is a good option for sending this log information to external solutions.
- Real-time logging can be send by writing function app trigger on event hub resource.
- Microsoft Sentinel provides a unified overview of the cloud resources and can collect on-premise data centers information. Sentinel provides a dashboard view on security events like failed logins , abnormal activity and relevant connections from these events. LogRhythm provides similar services. It is SIEM tool.
- AZURE storage accounts or data lake storage services can be used for storing logs for long-term use and analysis. These services are good for cheap retention. Access tier for storage account enables Hot , Cool and Archive.
- AZURE log analytics work space queries using K-SQL (Kuso Query language) can help in analyzing the logging information.
- Kibana dashboard view can present the AZURE log analytics workspace query results.
What fields needs to be in Logs?
| Field | Description | Example |
| Timestamp | date and time of the log entry | 2022-01-27T13:19Z |
| Log Levels | Trace – Most detailed and Verbose log level Debug – for debugging code locally during development Information – General application flow when users interacting with the application in production Warning – This level entry indicates message potentially can be problematic Error – level used in production to log logic errors. Critical\Fatal – Unrecoverable error occurred in application and unable to process the request. | Information |
| Message Template | Template contains placeholders for replacing with values | {User ID } did {Activity name} |
| Correlation ID | Each application request should have unique identifier also referred as correlation id that goes through each microservice. Each microservice that receives the request uses this correlation id from request and uses in logging. Correlation ID is so important for chaining the related events and trouble shooting the issue in microservices. | 5734545b-43df-5d8d-1ee6-1w334g5 |
| Action Name | Class/Method for action | |
| Request Path | path for the request | /api/Orders |
| Exception details | In string format | |
| Service ID | OrdersSVC | |
| Environment | Dev, QA , Production | |
| Machine name | FGE123DER43 | |
| HttpContext | ||
| User ID & Roles (make sure these are anonymized) | ||
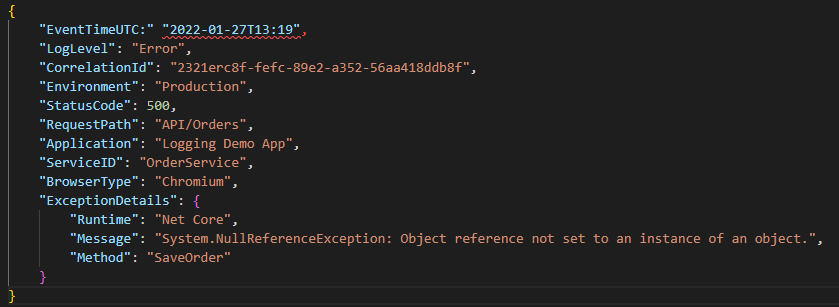
Sample Structured logging object looks as follows

Monitoring options in AZURE
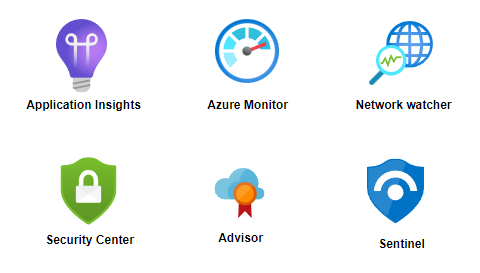
AZURE monitor collects the data about performance of the applications code and data on azure resources. It can collect data from REST client including on-premise applications. AZURE monitor is central hub for all monitoring services. You can drill down the collected data using Kusto Query language (K-SQL) or using pre-defined azure run books. All of the monitoring services in AZURE are doing for specific tasks.
Available AZURE monitoring services are

