Quickly determining the root-cause of live site issue(s) that hosted in AZURE is important. The standard alerts that you setup in monitoring system might help you in alerting the problem and wouldn’t always help you in finding immediately the root-cause of the failure. Azure Portal introduced a new feature called “Application Change Analysis” under AppService.
What is Application Change Analysis? How it helps in finding the root-cause of the issue?
Azure Application change analysis provides a centralized list of changes to start investigating your web app failure. It helps you to find who changed and what changed. The changes it include are both infrastructure and deployment. The following diagram shows internals of Azure Application Change Analysis
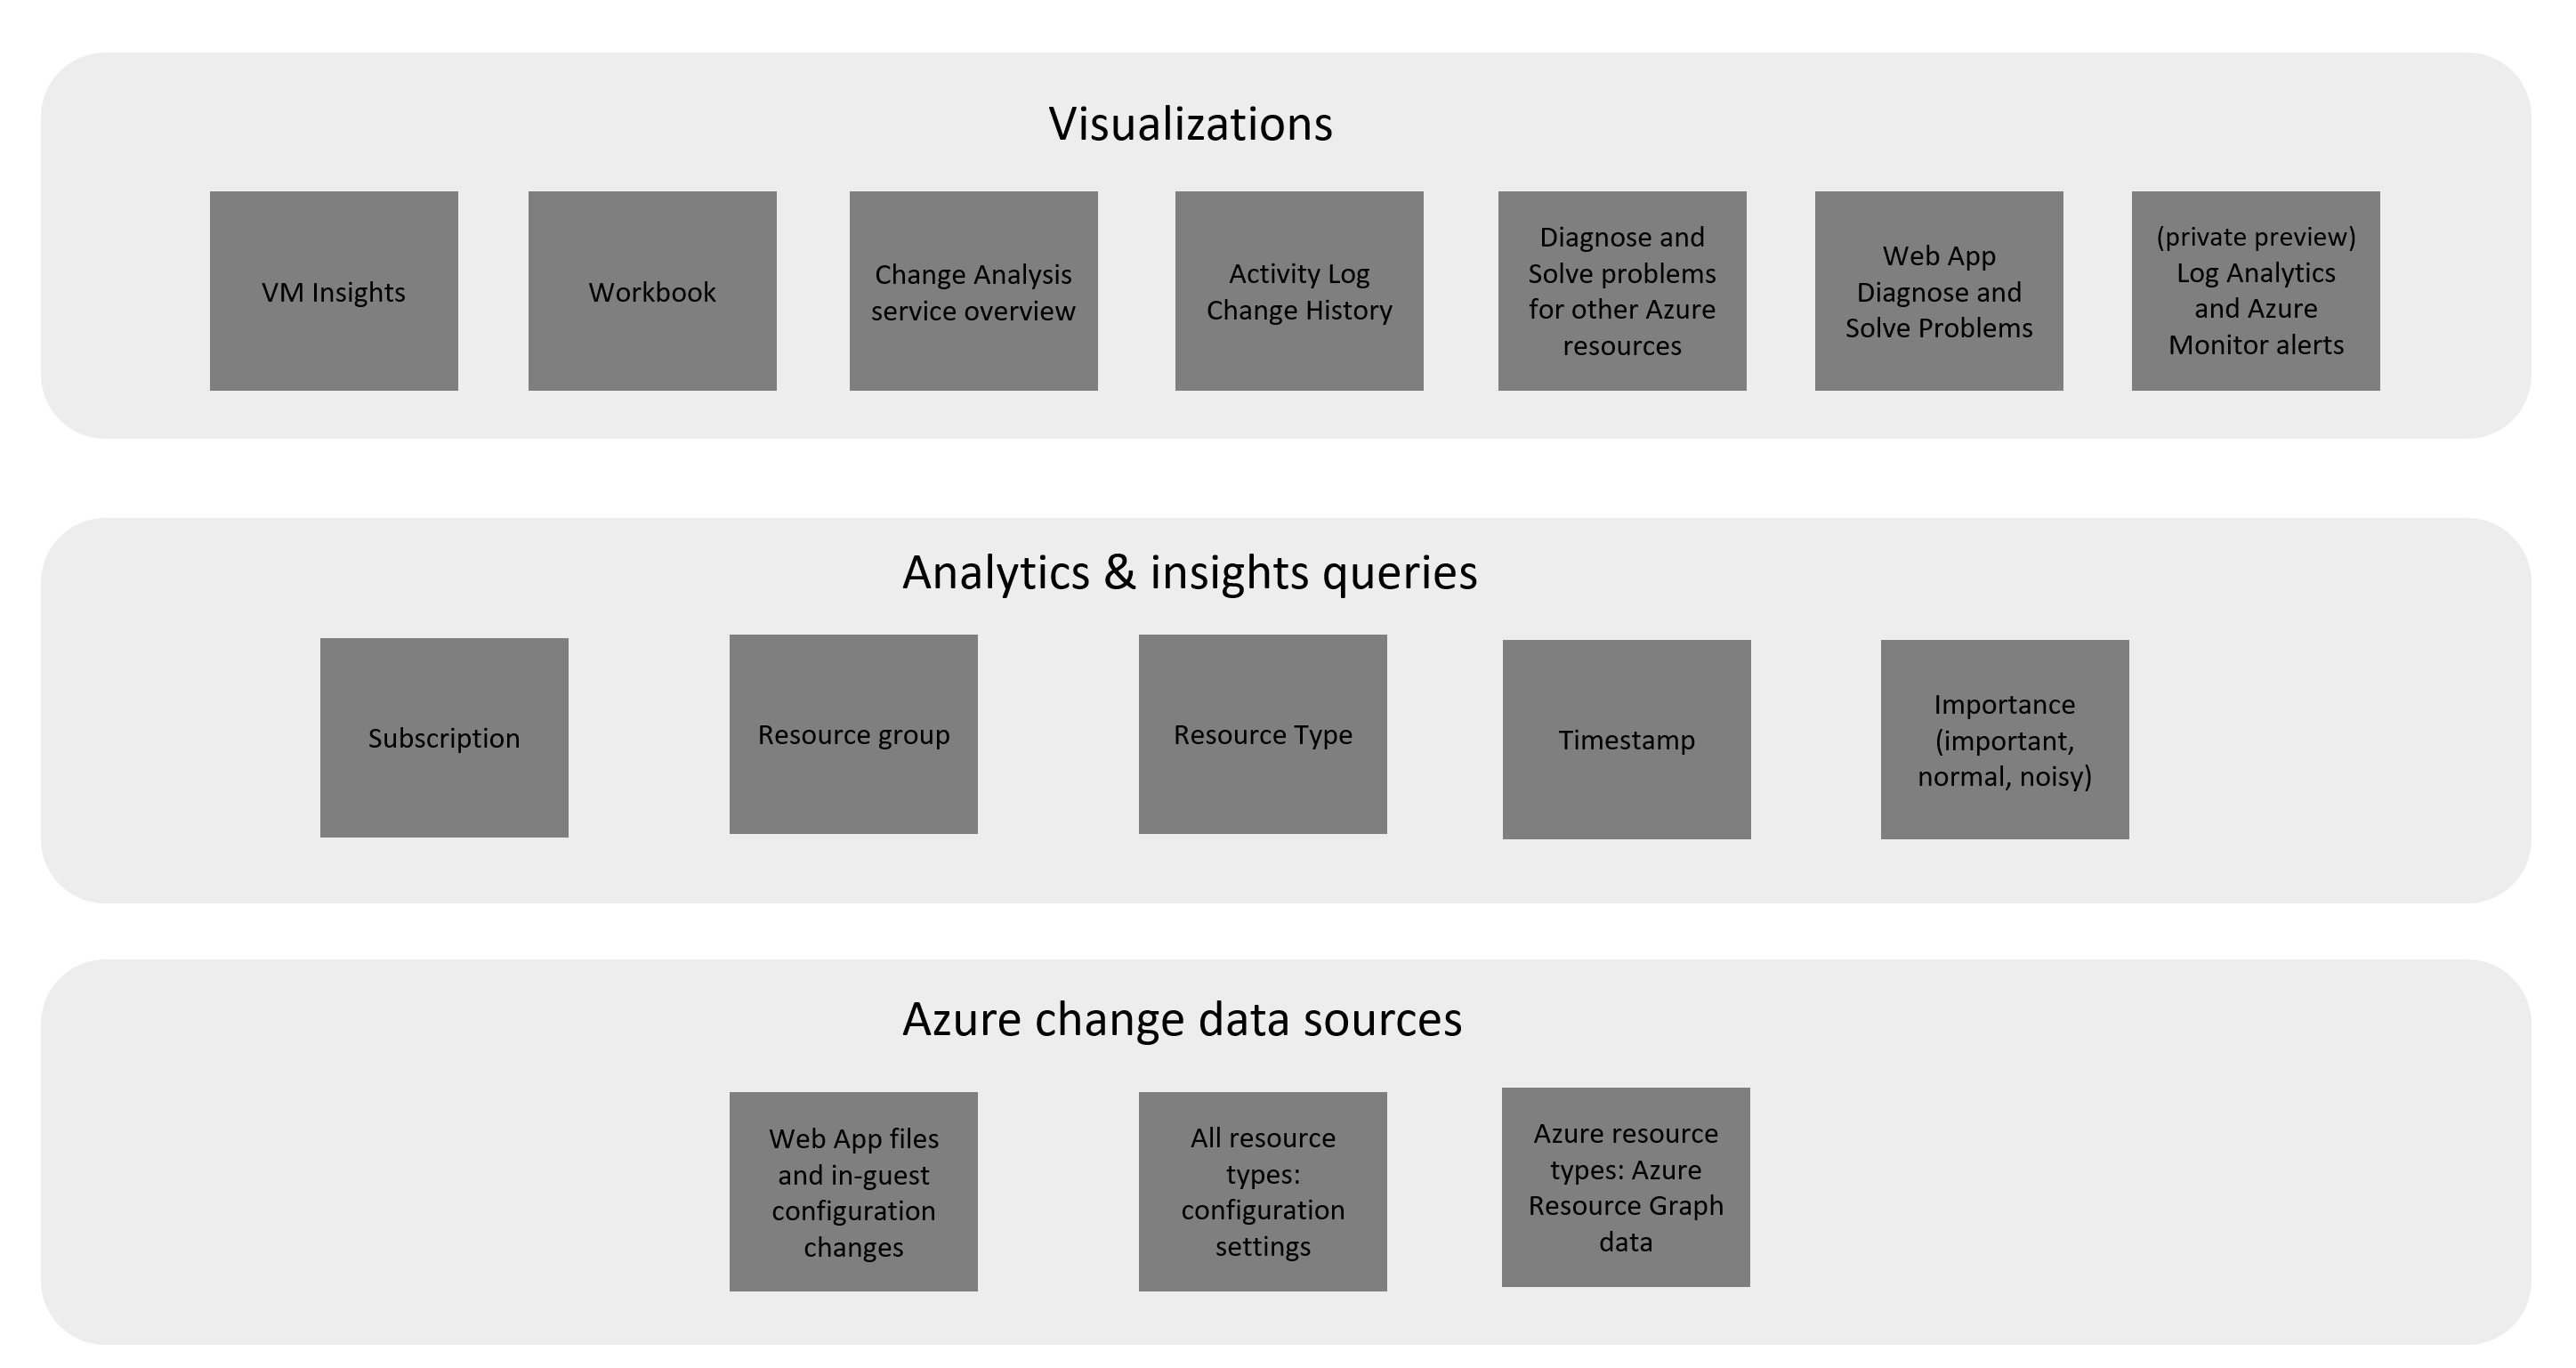
The common question, it was working fine till few hours ago and it stopped working now!!! we usually spent some time in going through logs to find what was wrong? Application change analysis scans your web application and presents the changes to you.
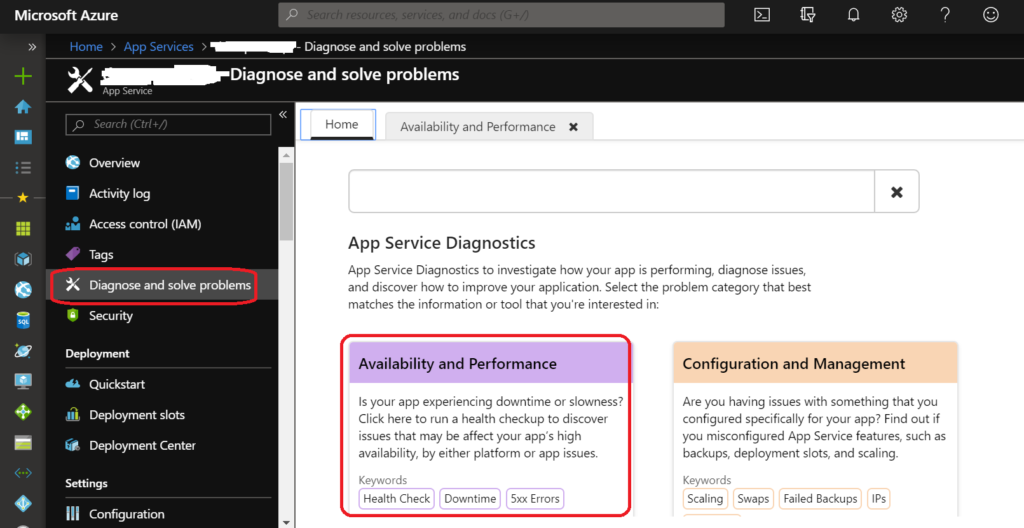
- In order to view changes , first navigate to App service and click Diagnose and solve problems and select availability and performance
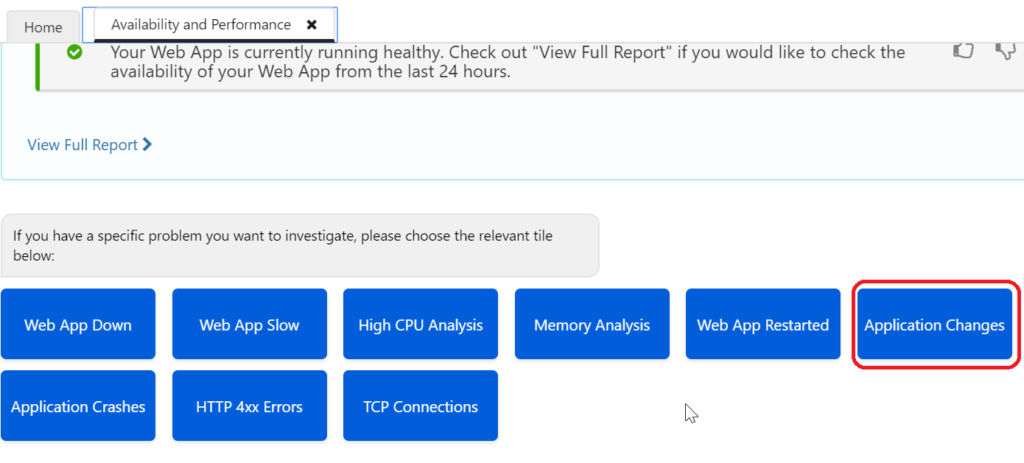
2. Select Application changes from list as shown in following screen shot
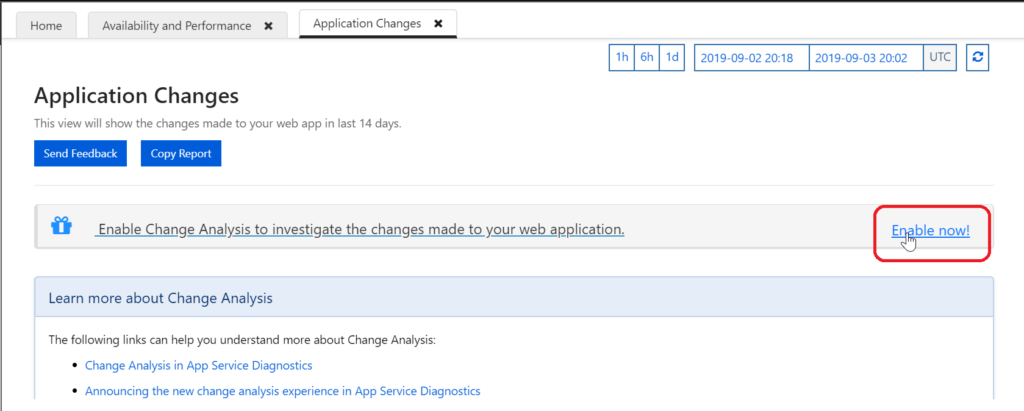
3. To enable Change Analysis on Web App, Select Enable now
4. Turn on Change Analysis and say save

5. To Access the Web App Changes, Navigate to Diagnose and Solve problems –> Availability & Performance –> Application Crashes . You will get details on those changes. example follows
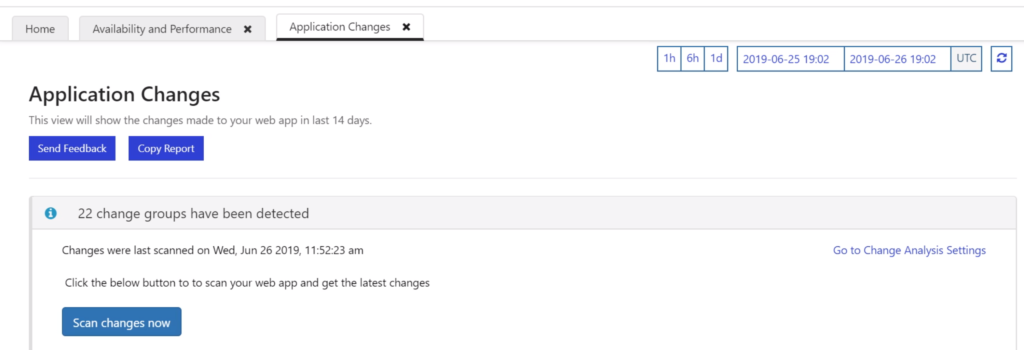
By default Change Analysis captures the changes made to web application in last 14 days. Periodically (every 4 hours) it takes the snap shot of your application. If you want to know current state of your app then click Scan changes now button. It then shows the following graph
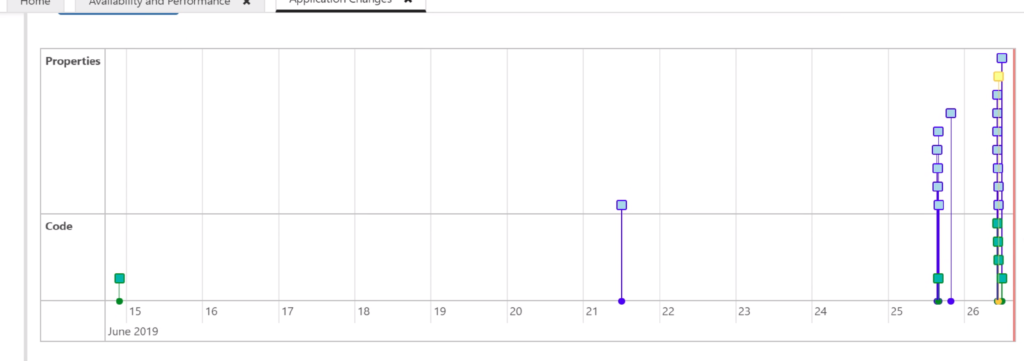
Green dots in chart indicates code, environment variables change and Blue dots are properties that changed it means resource level changes. Yellow dot indicates where you are while you are navigating the chart.
In order to find a reason for failure go dot by dot in chart, it will show you the details as follows
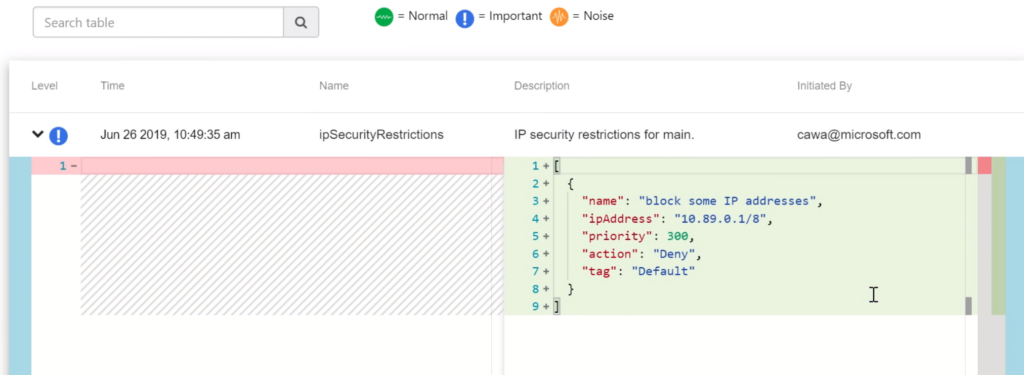
It clearly tells you who made the change and what it is in detail with date-time stamp. It is useful especially when multiple teams are working on same project. The change detection is at ARM level.
Note: look for Normal and important icons for changes and Noise ones are less important and shows dll level changes.
How it is working?
It is subscription level resource provider. You can register it globally or individual web app level
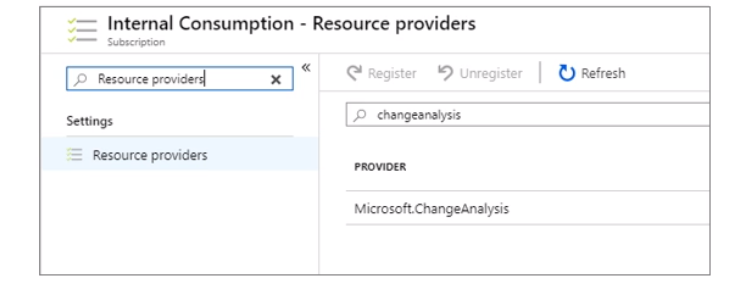
The changes are stored in azure storage called Azure Resource Graph db which includes infrastructure level changes. Another source that saves the changes is App Services back-end.
Note: currently this feature is in public preview. Future Microsoft wants to extend this feature to All resources not just Web Apps. More details on this topic can be read from here