|
The Analytics Platform in SharePoint 2013 replaces the Web Analytics Service application in 2010. Analytics engine has been completely redesigned in SharePoint 2013. This post discusses the New Analytic engine features in SP 2013. |
|
SharePoint 2013 Analytics Features
- Item-to-Item recommendations based on user behavior Example: People who viewed this also viewed xyz
- Promote search results based on an items priority
- Explicit view counts for Lists
Advantages
- The new analytics engine find relevant information based on clicks, views etc
- You can get hot indicators and usage numbers based on number of views and number of unique visitors
- You can understand how much content has been used
- This engine is extensible for 3rd parties
Processing and Storing the Analytics Data
All the analytics data that used for reporting process is contained in search service application, Actions like views and clicks and other search metrics are pushed into reporting database. An analytics reporting job examines data for creating data points used for reporting.
Analytic System Components
Event – each item comes into the system as an event with certain parameters that indicates something has been seen or viewed etc
Filtering and Normalization – This component tells how to use the event information, Example certain types of events are directly written into the usage files. You can configure up to 12 custom events in addition to what comes in out of box.
Reports – A number of reports are available including
Top queries
Most popular documents in library or site
Historic usage of an item
To get to the Usage Reports in SharePoint 2013
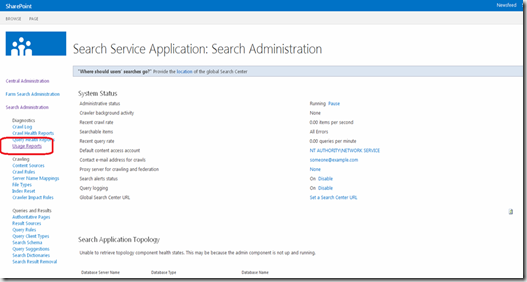
Open central administration and manage service application click search service application then click the Usage Reports link in left to see the reports at application level
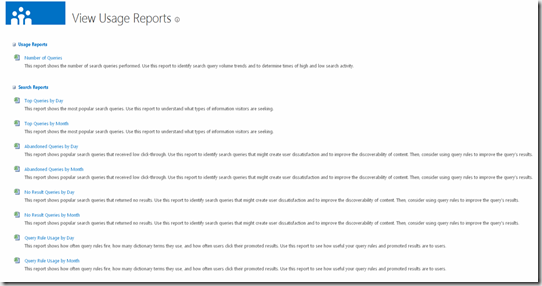
You can see the some of the default reports available out of the box , for example number of queries that have been run , top queries by day and month as shown below
You can find the reports in individual site level , for example navigate to the document library in site and click library you can find the Most popular Items option as shown below
As my document library not having any documents it would not show any results but you will get results as shown below
It shows how many views an item had in recent time. This way you can have the quick view on documents and know how popular it is over the time.
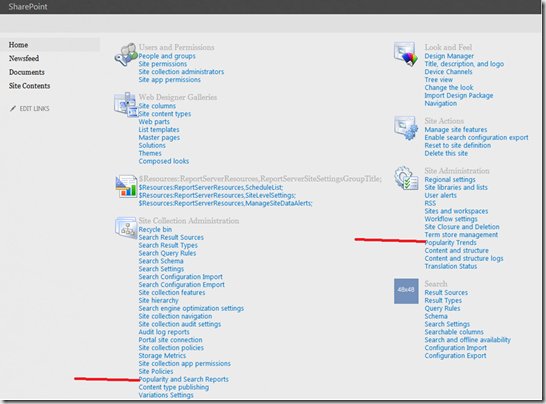
You can also get these analytic reports at site collection level. Go to the site settings
Click the Popularity Trends link under Site Administration then you will get the report on site level
| Share this post : |  |
 |
 |
 |
 |


Hi,
I click on the Most Popular Item on my Document Library. Then, the Document Library listed down all the documents, but the Recent and Ever keep giving me 0. I have access each document by clicking, viewing, download a copy, but still 0, nothing.
I crawled the web Search Application Services, and still 0. The documents are added weeks ago, still 0 by now.
Any solution?
Regards,
Beng
I am also facing same issue. Did u find any solution for this one?
The new site analytics reports in SP 2013 are a big step back. There are 3rd party products that provide significantly better reporting AND support – check out Angelfish Software.
http://analytics.angelfishstats.com
Another 3rd-party SharePoint Analytics solution that is compatible with 2013 platform from HarePoint: http://www.harepoint.com/Products/HarePointAnalyticsForSharePoint/Default.aspx