|
This post discusses about using Performance Monitor tool to create a base-line using different performance counters. It also discusses analyzing hardware resource bottlenecks and retrieving performance monitor data in sql server using views. Performance Monitor Tool collects the detailed information of system resources including memory, processor , disk and network.SQL Server 2008 provides extensions to Performance Tool to analyze various areas in SQL Server. |
 |
Performance Monitor tool provides performance counters to represent the specific aspects of a resource.
What is Performance Counter?
Performance Counter is a value of performance object.
example:
Performance object: Processor
Counter: % Processor Time
The sys.dm_os_performance_counters view displays the SQL Server counters within a query.
Following query returns the values for Logins per sec
1: SELECT cntr_value
2: FROM sys.dm_os_performance_counters
3: WHERE OBJECT_NAME = 'kalyan-pc'
4: AND counter_name = 'Logins/sec'
There are several DynamicManagementViewes(DMV) to collect the information about SQL Server.
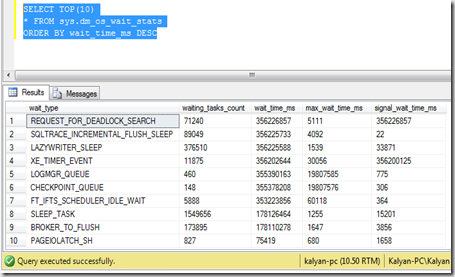
The DMV sys.dm_os_wait_stats shows the aggregated view of threads that are waiting for resources on SQL Server.
The following query is an example for this DMV
Common types of wait is I/O. If you see ASYNCH_IO_COMPLETION or IO_COMPLETION under wait_type column in above result then you may experiencing I/O contention. Read more about wait_types here
Identifying Hardware Resources Bottlenecks
The most common bottleneck is usually I/O either from memory or from the disk. use the above mentioned DMV to identify these bottlenecks.
Bottleneck Resolution Decrease the arrival rate of requests to the resource.
example: adding appropriate indexes to limit the amount of data accessed or creating a partition on table.
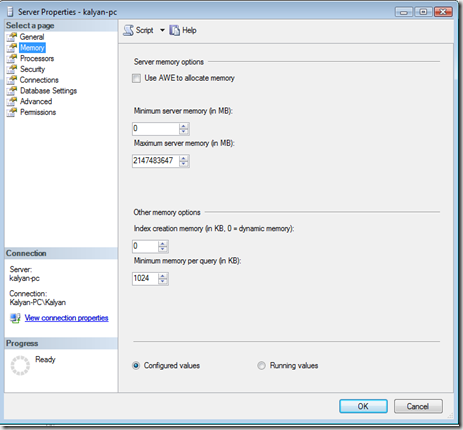
Memory Bottleneck SQL Server uses memory pool to manage data and query execution plans. SQL Server manages this memory pool by growing or shrinking the size dynamically. You can configure this Dynamic Management memory in SSMS as shown below. right click the server and go to properties and select memory page
This Dynamic memory can be configures using two properties in above dialogue
Minimum server memory(in MB) it is the floor value for the memory, once it reaches to this value then it starts committing pages.
Maximum server memory(in MB) it is the ceiling value to limit the maximum value of memory pool.
Microsoft recommendation is use 0 min property and max server memory will be maximum physical memory of the system. assume you are running single instance on server.
Performance Monitor Counters to analyze the Memory
| Counter Name | Description |
| Available Bytes | available free physical memory |
| Pages/Sec | number of pages read from or write to disk. Average value must be less than 50 |
| Page Faults/Sec | indicates the total page faults per second |
Memory bottleneck resolutions
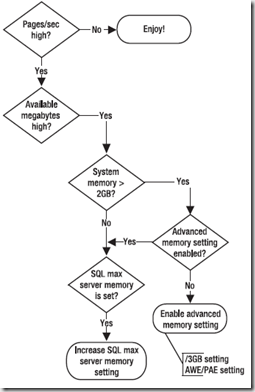
If the pages/sec count is high then check available physical memory check if system memory > 2GB, if yes then enable the advanced memory setting
Enabling 3GB of process space
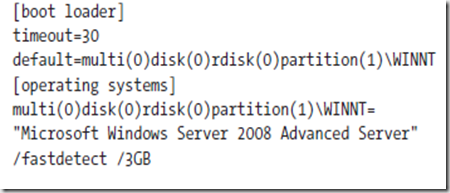
32 bit windows operating systems are limited to use 4GB of memory.Out of 4GB , by default 2GB is reserved for operating system and remaining is allocated to application. If you specify a /3GB switch in the boot.ini file of 32 bit OS, then OS uses only 1 GB of address space and application can access up to 3GB.
To allow SQL Server to use the 3GB of your physical memory. You can add the 3GB switch in boot.ini file as below
Performance Counters to analyze the disk performance
| Counter | Description |
| % Disk Time | Percentage of time disk was busy. value must be less than 85%. |
| Disk Transfers/Sec | Rate of read/write operations on disk. Maximum value less than 100 per disk |
| Disk Bytes/Sec | Amount of data transfer to/from per disk per sec. Maximum value < 10 MB per second |
| Avg Disk sec/read | avg value < 10 ms |
| Avg Disk sec/write | avg value < 10 ms |
Disk Bottleneck Resolutions
Common resolutions are
- Using a RAID array
- Using a SAN system
- Creating multiple files and multiple file groups
- Using Partitioned tables
Creating multiple files and multiple file groups
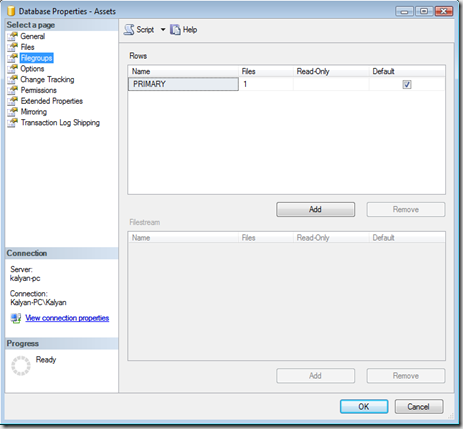
The data files belonging to databases can grouped together in one or more filegroups. if you add multiple files to multiple file groups across drives then your work can be done in parallel across the groups and files. You can add filegroups to your database in SQL Server SSMS as below
Performance Counters to analyze Processor
| Counter | Description |
| % Processor Time | Percentage of time the processor busy avg value < 80% |
| Batch Requests/Sec | SQL Command batches received per second |
| SQL Compilations/Sec | Number of times SQL is compiled avg value > 100 |
Processor Bottleneck Resolutions
- Optimize the application performance load
- Eliminate the excessive compiles or re-compiles
- Running with more efficient controllers and drivers
Performance Counters to analyze Network
| Counter | Description |
| Bytes Total/Sec | Rate at which bytes are transferred on Network Interface Card Avg Value must be < 50% NIC capacity |
| % Net Utilization | % of network bandwidth in use on a network segment avg value must be < 80% network bandwidth |
| Share this post : |  |
 |
 |
 |
 |
