|
You can view the current connections and processes that running on a sql server instance in two ways
|
 |
Monitoring Process in Activity Monitor
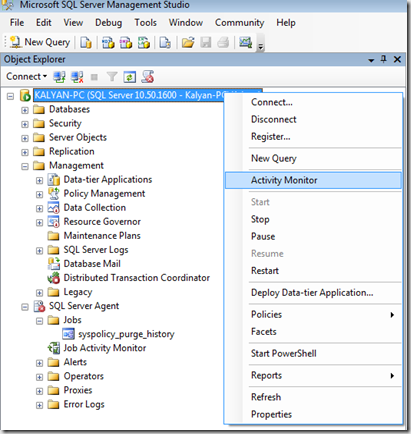
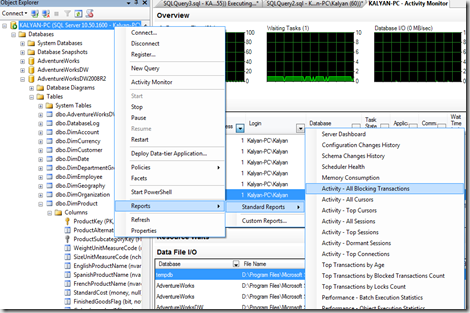
To open the Activity Monitor in SQL Server Management Studio Right click the server then select the Activity Monitor option as shown below
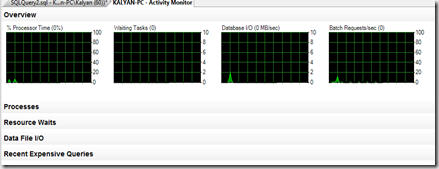
Activity Monitor gives you an option to view who is connecting to your machine and what they are doing? It shows 4 graphs Processor Time, Waiting Tasks, database I/O and Batch Requests
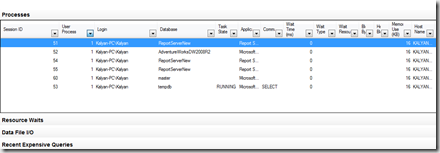
The columns in the Activity Monitor are very useful to debugging you to understand the
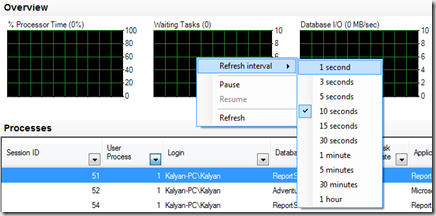
You can refresh the data on graph by right clicking on it and selecting refresh interval. The Default refresh rate is 10 seconds.
To demonstrate to view the lock processes on your SQL Server
Write the following query in sql server management studio in new query window as follows
1: BEGIN TRAN
2: DELETE FROM [DimProduct]
3: WHERE ProductKey = 10
4:
because we have not written Commit TRAN command nothing will saved to the database. Now write the following T-SQL in new query window. do not close the first window
1: SELECT * FROM dbo.DimProduct
Because the first query locked the rows, this query hangs the process
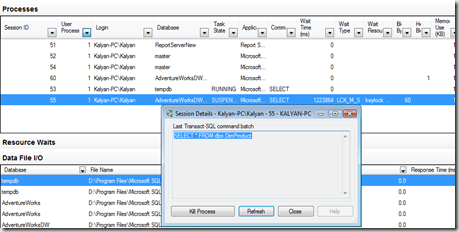
To view this locked process on Activity Monitor, hover the mouse on query window and see the process id of select statement and select that process id in Activity Monitor
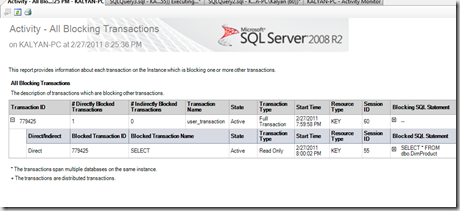
The other way to view the Blocking Transactions in standard report is right click on the server select Reports then Standard Reports and select Activity-all blocking transactions.
You will get the report in tabular report as follows
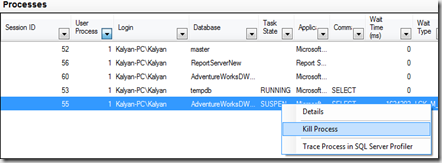
To kill the blocking process or locked process, go to the Activity Monitor and right click on the blocking process and say Kill Process
Monitoring Processes in T-SQL
You can also monitor the activities of sql server using T-SQL.
sp_who and sp_who2
Both procedures returns the details of who is connecting to your server. sp_who is a sub set of sp_who2 details.
To see all connections to your server, run sp_who2 with out any parameters, to see active connections pass active as parameter. sp_who2 ‘active’. you can even pass the process id to sp_who2 procedure.
To see a user connections that performed write operations write the following query
1: SELECT * FROM
2: sys.dm_exec_sessions WHERE is_user_process = 1
3: AND writes > 0
SQLDiag.exe
It can be used to collect the information about different resources in your system like
- SQL Server Error log
- Windows Event Log
- SQL server blocking processes
syntax:
1: sqldiag /B +00:03:00 /E +00:02:00 /OC:\temp /C1
/B and /E switches can be used to start and stop diagnostic in 24 hour time and it sends the results to temp directory
The default location of this executable is C:\Program Files\microsoft sql server\100\tools\Binn and can be run from command prompt
| Share this post : |  |
 |
 |
 |
 |
