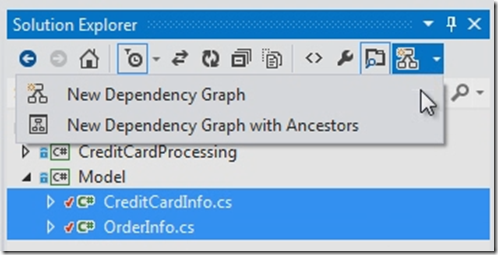
| Dependency graphs helps you visualise how your code is organised and understand its dependencies. This could be useful when you are working with un-familiar code. You can easily get visual overview of your code by creating dependency graphs.You can create dependency graphs in Visual Studio 2012 ultimate by choosing Architecture menu and then click Generate Dependency Graph –> for solution |  |
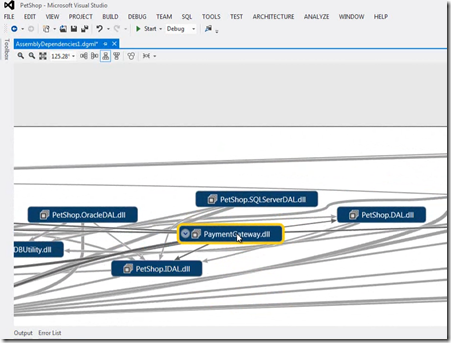
You can create dependency graphs to get an overview on your solution. The below graph shows the top-level assembly and their dependencies, You can browse the graphs in different ways and you can also rearrange the items on the graph.
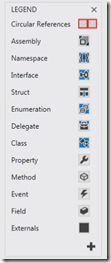
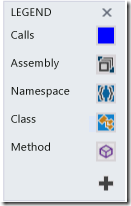
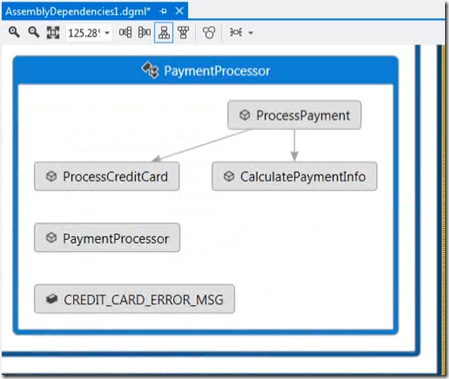
You can expand assembly to see namespace, class and members . The legends are shown below
You can choose messages, items that interest you and create a graph of those items.
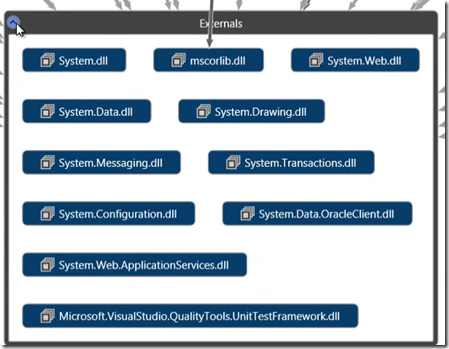
You can also find all external assembly dependencies that your solution has in externals group.
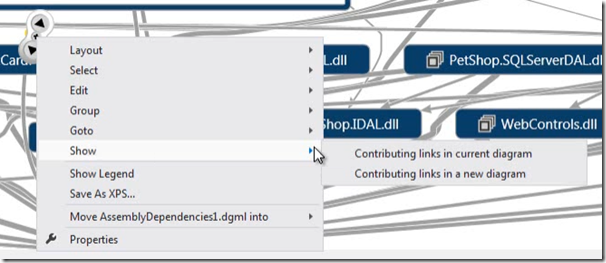
You can also explore the external dependencies by examining the links, the thicker the link the more dependencies that link represent. To explore a specific link , you can create a graph just for the items in that link
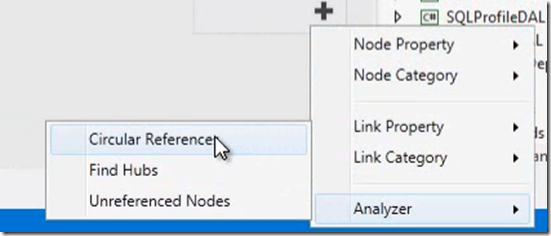
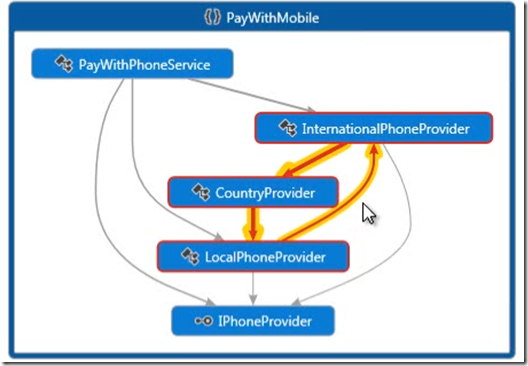
You can also go quickly and directly to the code from graph. You can find the trouble parts in your code by running an analyzer, for example you can find circular dependencies
You can further examine these dependencies by creating a graph for the items in the circular reference. Without going to the files and lines of code you can organize your code.
As an example you might be in the middle of code-review , you can create a dependency graph to help you to understand the pending check-in files or code changes, you can then apply pending changes filter in solution explorer then you can choose the related items and can create a graph for those items
You can also add notes to that graph to give feedback and save the graph as part of the review. Finally you can edit the graph to pass the thoughts and ideas of about your code without changing the code it self.
| Share this post : |  |
 |
 |
 |
 |

