This post explains how to analyze and navigate complex code using Code Map in Visual Studio 2012. The new Code Map feature in Visual Studio 2012 ultimate allows you to create visualizations in your source code. This helps you to identify and quickly fix the bugs in your code. You need to install Visual Studio update to get this feature from here.
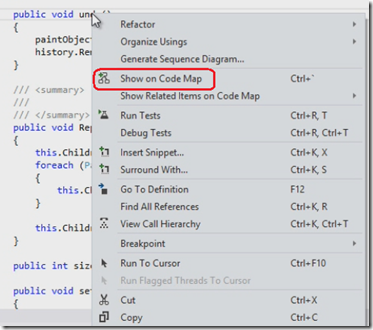
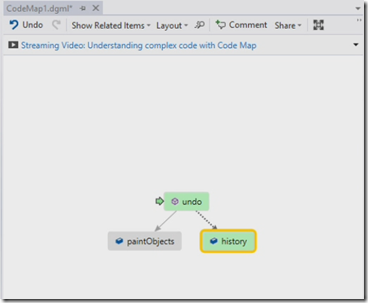
With Visual Studio 2012 you can right click on target method and say Show on Code Map which creates a visualization of the method to the right of your editor window
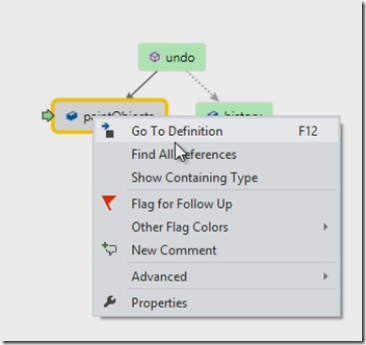
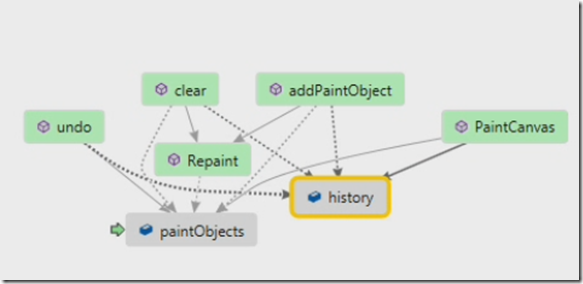
Hovering items on the Code Map displays tool-tip with additional information about the item and about the relationships. The green arrow indicates where the insertion point is in your code which creates live link between the source code and Code Map. You can continue your investigation by displaying additional relationships. for example when click Find All references then it shows all the objects that are interacting with the paint object
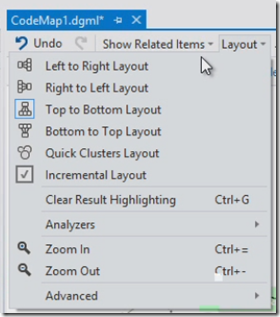
The Code Map is an interactive design surface, you can move items around and zoom in and out for better view. If layout is cluttered then you can choose more options as shown below
With Code Map you can associate comments with individual items and you can share the Code Map for others. You can also save the Code Map for later analysis.
| Share this post : |  |
 |
 |
 |
 |
