This post shows improvements that made in Visual Studio 2015 to debugging.
When you set a break point inside VS 2015 editor then you will notice there is toolbar pops up as shown in the following picture
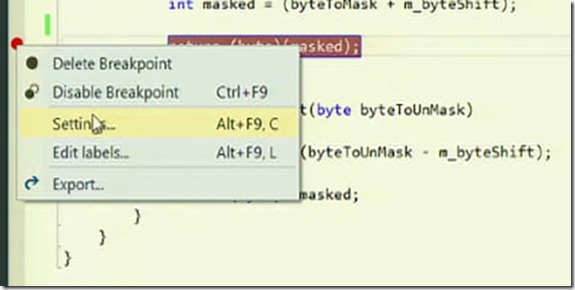
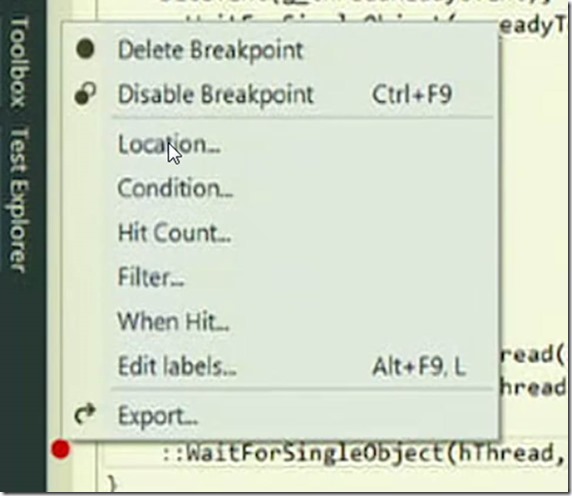
Using the toolbar either you can open the settings or enable or disable the break-point. You can also notice there are fewer options in the breakpoint context menu
The same screen in Visual Studio 2013 looks as below
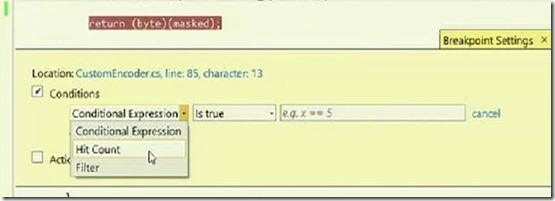
When you hit settings icon in Visual Studio 2015 then you will see a modal window with the options
You can stop the debugger when certain condition met in the code.
Hit Count is another breakpoint which stops the debugger only when it reaches the location at certain number of times. Filter break point can be used when you are running the code in parallel. You can combine all those three options.
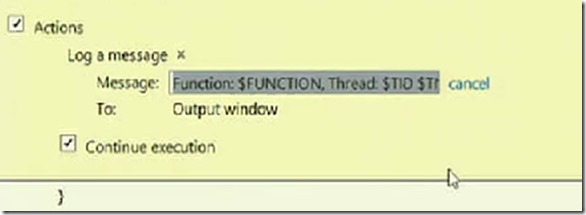
The available action now is printing a message to the output window. You will also get a Intellisense in side this modal window.
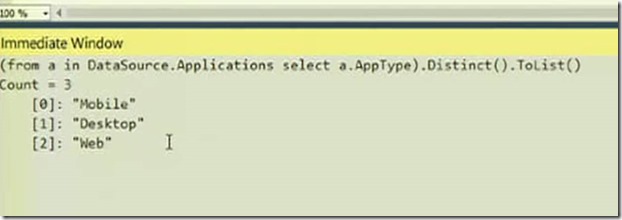
Improvements for C# and VB in watch windows, now you can execute lambda expressions inside immediate window.
